Lab-5 Sinusoidal Waveforms:
Name:___________________________
Date:___________________________
Objective:
The objective of this lab is to use bench equipment to set and measure sinusoidal waveforms and the effect of capacitor.
Equipment:
1 Set BNC to BNC Clip Leads, Function Generator, Oscilloscope, DMM. One 100 Ohm Resistor, One 1 µF capacitor, One 10 µF capacitor.
Procedure:
- Amplitude Measurements: For a sinusoidal voltage, the peak amplitude is one half the peak-to-peak value, and the effective or root-mean-square (rms) value is 0.707 times the peak amplitude.
Calculate the peak amplitude and the peak-to-peak value for each rms value in Table 5-1.
On the Function Generator, generate a sine signal with 1 kHz frequency.
Set the DMM to measure AC Volts. This will read the rms value.
Connect the Oscilloscope and the DMM to measure the output of the Function Generator.
Set the output Amplitude of the Function Generator to each of the Peak values that you computed in Table 1, and record the corresponding Multimeter reading in the Measured/DMM rms column.
On the oscilloscope, determine each peak-to-peak value using two methods. First, multiply the number of division deflection (the vertical distance from bottom to top of waveform) by the number of volts per division. Second, use the Measure, Voltage, P-P feature of the oscilloscope. This gives you readout of the peak-to-peak value of the voltage at the bottom of the oscilloscope display.
Table 5.1 Amplitude Measurements.
| Measured | Calculated | |||||||
| DMM | Oscilloscope | |||||||
| rms | Peak | Pk-Pk | rms | #of div | V/div | V(Pk-Pk) | V(Pk-Pk) Readout | |
- Period and Frequency Measurements: The frequency of a waveform is related to its period T by f = 1/T. If T is in seconds, then f is the frequency in Hz.
Calculate T, the period for each of the frequencies listed in Table 5-2.
Obtain a sine wave and set the frequency to each of the values listed in the table. Since the amplitude does not matter here, you can choose any amplitude you want.
At each frequency, Autoscale the oscilloscope, read the number of divisions in one cycle, and the time/div displayed on the screen.
Calculate the period, T = (div/cycle) x (time/div), and then calculate the frequency, f = 1/T.
At each frequency, press the Time button in the set of three Measure buttons at the top center of the oscilloscope front panel, and then press the button under Frequency at the bottom of the display.
Table 5-2: Period and Frequency Measurements.
| Measured | Calculated | |||||||
| Frequency (Hz) | Period | Div/Cycle | Time/Div | Period | Frequency | Frequency Readout | ||
| 100 | ||||||||
| 250 | ||||||||
| 1 K | ||||||||
| 2 K | ||||||||
| 5 K | ||||||||
| 20 K | ||||||||
| 50 K |
Procedure :
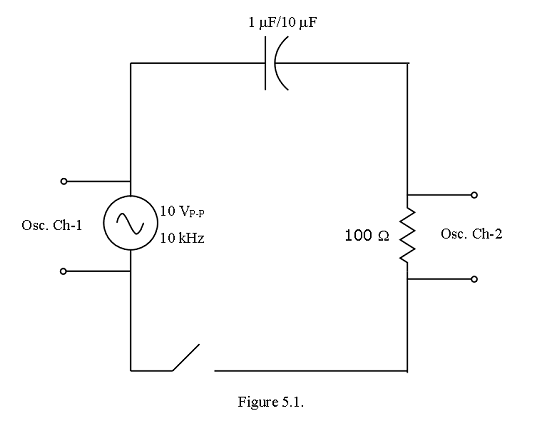
Set the function generator for a 10 volt amplitude peak-to-peak sine wave at 1 kHz and connect to Channel 1 of the oscilloscope.
Capture the waveform by saving the waveform on to a USB Flash device.
Record the frequency, period, Vp-p, and Vrms of the waveform.
Build the circuit in Figure 5.1.
Connect channel 2 of the scope across the resistor.
Capture the two waveforms by saving the waveforms on to a USB Flash device.
Record the frequency, period, \(V_{p-p}\), and \(V_{rms}\) of the second waveform.
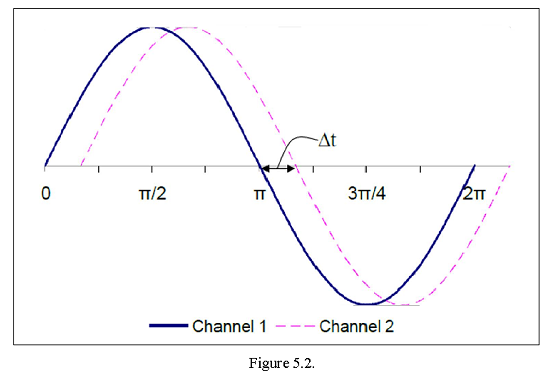
Determine the phase difference between the two waves. The phase difference is given by the time delay between the two waveforms, where “\(\Delta\)t” is the phase difference as shown in Figure 5.2. Also observe which of the two waveforms lead.
Calculate the phase shift: \(\Phi\) = \(\Delta\)t * f *\(360^o\)
Use a Digital Voltmeter to verify your \(V_{rms}\) oscilloscope measurements.
Replace the 1 \(\mu F\) capacitor with a 10 \(\mu F\) capacitor and repeat steps 6-9.