Lab-8 AC Circuits, Phasors and Impedances:
Name:
Date:
Objectives:
The objectives of this laboratory are to gain practical understanding and experience of AC circuits by
studying and measuring voltages and currents in series RC, RL and RLC circuits,
calculating and measuring impedance,
measuring and graphing phasors and phase shift between voltage and current,
observing impedance change as a function of changing the frequency of the applied source.
Components & Equipment:
Resistors: 90 Ω, 1200 Ω, 470 Ω, 560 Ω, 300 Ω
Capacitors: 0.22 µF, 0.22 µF, 1 µF, 1 µF
Inductors: 100 mH
Diode: 1N4004
Breadboard
Agilent DMM
4 – Long leads
Bag of Wires
BNC-to-BNC cable
Two Oscilloscope Probes
Pair of Banana to Alligator cables
BNC-to-Alligator Cable
T-connector
Review of AC Signal:
The term AC is literally an abbreviation for Alternating Current. An AC voltage might be defined by,
\[\begin{equation} V(t) = Vsing(\omega t) \tag{8.1} \end{equation}\]
What is the implication of a sinusoidal voltage or current? The magnitude of the function varies between + V and -V volts at a frequency of 60 H (hertz). The frequency of all power distribution systems in the United States is 60 Hz. In most of Europe and Asia including China and Japan the frequency of the power system is 50 Hz.
We recall that t (time, in seconds), f (frequency, in hertz) and ω (radian frequency, in rad/sec) are related by,
\[\begin{equation} \omega = 2\pi f; f = 1/T; T = Time Period \tag{8.2} \end{equation}\]
The implication of a 60 hertz sine wave voltage is that the polarity of the voltage changes from positive to negative, 60 times per second. Gaining this knowledge, let us take a look at what goes on in an AC circuit.
Laboratory Exercises:
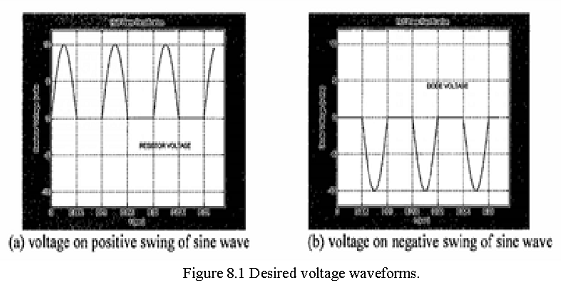
Part-1: Build a half wave rectifier circuit. Half wave rectifier. The purpose of this exercise is to illustrate the nature of the positive polarity and negative polarity of a sinusoidal signal. Assume you are given a 4700 Ω resistor and a 1N4004 diode. You are to use these elements in a circuit connected to a sinusoidal signal source so that you produce the signals shown in Figure 8.1. Show your circuit diagram that produces these waveforms. Measure and record the resistor voltage and the diode voltage. Obtain a print out of both the waveforms.
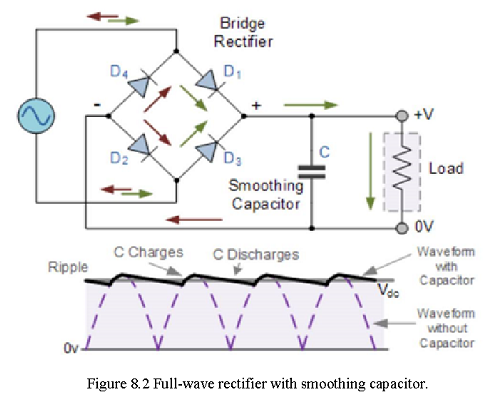
Full-wave rectifier with smooth capacitor as shown in Figure 8.2
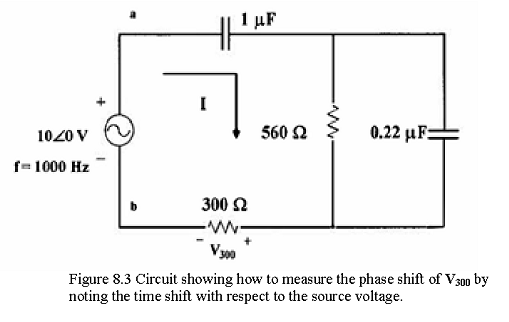
Part-2: Circuit impedance. Connect the circuit of Figure 8.3 with a source as shown below. Measure and record the value of \(V_{300}\), both magnitude and phase. You should measure the phase shift of \(V_{300}\) by noting the time shift with respect to the source voltage.
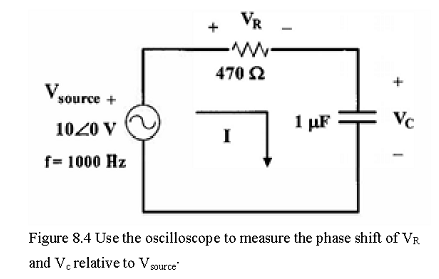
Part-3: Series RC circuit. (a) Connect (build) the circuit shown in Figure 8.4. Measure and record the voltages Vsource, \(V_R\) and \(V_c\). Use the oscilloscope to measure the phase shift of \(V_R\) and \(V_c\) relative to Vsource·
Part-4: Series RLC circuit. (a) Connect (build) the circuit shown in Figure 8.5.
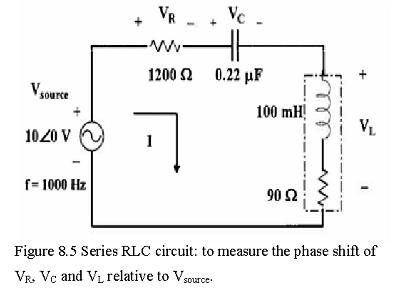
- Apply an input signal of 10∠0 at 1000 Hz. Measure and record the voltages Vsource, \(V_R\), \(V_C\), and \(V_L\). Use the appropriate oscilloscope keys to measure the phase shift of \(V_R\), \(V_C\) and \(V_L\) relative to Vsource.
Lab Report: (a) Show the rectifier circuit you designed for the rectifier circuit of Part-1.
Compare the directly calculated impedance from Part-2 with the impedance determined from \(V_{source}/I\), where I is calculated using I = \(V_{300}/300\).
Construct a small table showing the calculated and measured voltages for the RC and RLC circuits of Figures-3 and 4, respectively.
Use the measured values of voltages for Part-3 to construct phasor diagram. Use the measured values of voltages for Part-4 to construct a phasor diagram.