Lab-3 Convolution and Cross-correlation
Part-I: The formula for calculating the Convolution.
\[y(n) = x(n)*h(n)=\displaystyle \sum_{k=-\infty}^{\infty}h(k)x(n-k)\] Using MATLAB solve the following problems involving Convolution:
- \(x(n)=\bar{1},2,4\}\) and \(h(n) = \{\bar{1},1,1,1,1\}\)
- \(x(n)=\{\bar{1},2,-1\}\) and \(h(n) = x(n)\)
- \(x(n)=\{\bar{0},1,-2,3,-4\}\) and \(h(n) = \{\bar{1/2},1/2,1,1/2\}\)
- \(x(n)=\{\bar{0},0,1,1,1,1\}\) and \(h(n) = \{1,\bar{-2},3\}\)
- \(x(n)=\{\bar1,1,2\}\) and \(h(n) = u(n)\)
Part-II: Auto and cross-correlation.
\[r_{xy} (l)=\sum_{n=-\infty}^{\infty}x(n)y(n-l),l= \pm 0,\pm 1,\pm 2,...\] Equivalently \[r_{xy} (l)=\sum_{n=-\infty}^{\infty}x(n+l)y(n),l= \pm 0,\pm 1,\pm 2,...\] Reverse the roles of x(n) and y(n)
\[r_{xy} (l)=\sum_{n=-\infty}^{\infty}y(n)x(n-l),l= \pm 0,\pm 1,\pm 2,...\] \[r_{xy} (l)=\sum_{n=-\infty}^{\infty}y(n+l)x(n),l= \pm 0,\pm 1,\pm 2,...\] Therefore, \(r_{yx} (l)\) is simply the folded version of \(r_{xy} (l)\), where the folding is done with respect to \(l = 0\).
Lab Report: Submit a single file containing your lab report with a title, questions (if any) your name and ID number. Report must include the MATLAB codes, output figures and the relevant discussion. All codes must be pasted on your report. Lab reports must be submitted within the given date and time. Late submission is subjected to penalty of points.
Useful MATLAB Codes:
function [y,ny] = conv_m(x,nx,h,nh)
% Modified convolution routine for signal processing
% ——————————————–
% [y,ny] = conv_m(x,nx,h,nh)
% [y,ny] = convolution result
% [x,nx] = first signal
% [h,nh] = second signal
%
nyb = nx(1) + nh(1);
nye = nx(length(x)) + nh(length(h));
ny = [nyb:nye]; y = conv(x,h); % Built-in MATLAB conv function
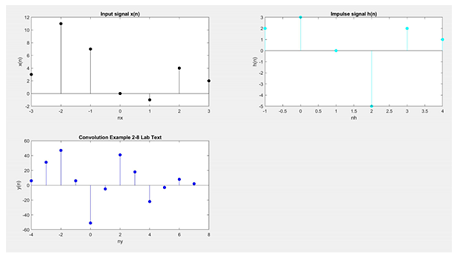
Example Convolution:
% Input signal
x = [1,2,3,1];nx = [0:3];
subplot(2,2,1);stem(nx,x,‘black’,‘filled’);
title(‘Input signal x(n)’)
xlabel(‘nx’); ylabel(‘x(n)’);
% Impulse signal
h = [1,2,1,-1];nh = [-1:2];
subplot(2,2,2);stem(nh,h,‘cyan’,‘filled’);
title(‘Impulse signal h(n)’)
xlabel(‘nh’); ylabel(‘h(n)’);
% Convolution
[y,ny] = conv_m(x,nx,h,nh);
subplot(2,2,3);stem(ny,y,‘b’,‘filled’);
title(‘Convolution Example’)
xlabel(‘ny’); ylabel(‘y(n)’);
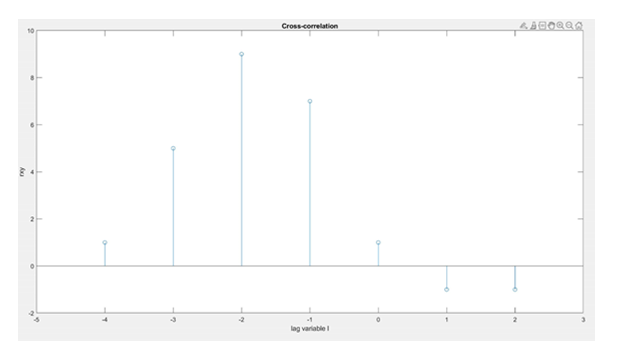
Example: Compute cross-correlation \(r_{xy} (l)\) for the following pair of signals.
x = [1,2,1,-1]; nx = [-1:2];
y = [1,3,2,1]; ny = [-3:0];
The output of cross-correlation:
\(r_{xy} (l)\) ={0,1,5,9,7,\({1_\uparrow}\),-1,-1,0} (Answer)
MATLAB Code:
x = [1,2,1,-1]; nx = [-1:2];
y = [1,3,2,1]; ny = [-3:0];
[rxy,nrxy]=conv_m(y,ny,x,nx) % Cross-correlation
stem(nrxy,rxy);
axis([-5,3,-2,10]);
xlabel(‘lag variable l’);
ylabel(‘rxy’);
title(‘Cross-correlation’);